Your bloodwork
tells a story.
Finally read it.
Labstrack turns scattered lab reports into clear, beautiful trends. Scan a report — names, values, dates and reference ranges file themselves into the right graphs, automatically.
Now on the App StoreWhy Labstrack
From paper pile to picture of your health
Labs print the same test ten different ways. Labstrack speaks their language so you don't have to.
Scan anything
Photo, screenshot or PDF — test names, values, dates and reference ranges are read for you, then shown for review before anything is saved.
Files itself
HbA1c, Hemoglobin A1c or just A1C — every result lands in the right marker graph, even when labs name or measure tests differently.
Ranges that match you
Each result keeps the reference range it was measured against — per lab, per draw — and ranges are picked for your age and sex.
See the proof
See exactly where every number came from
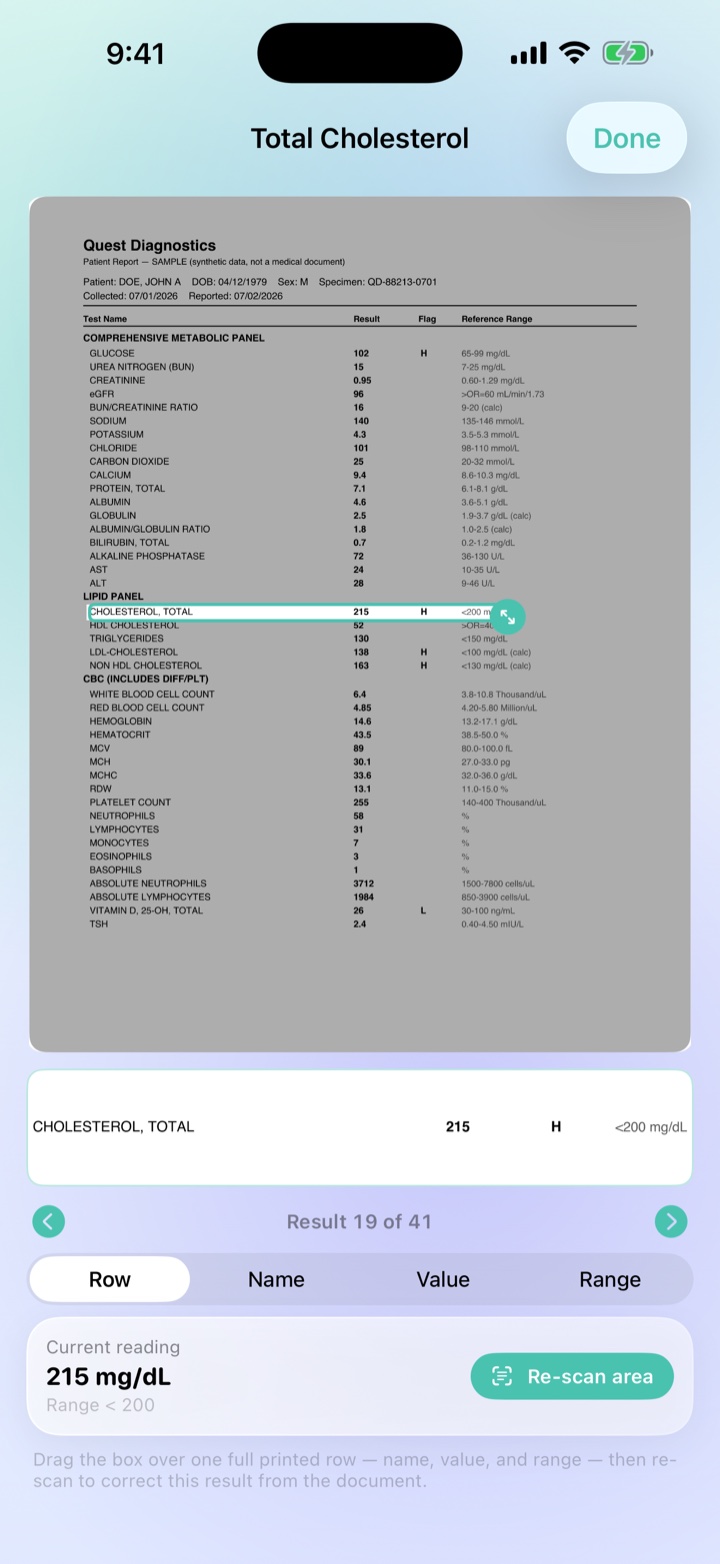
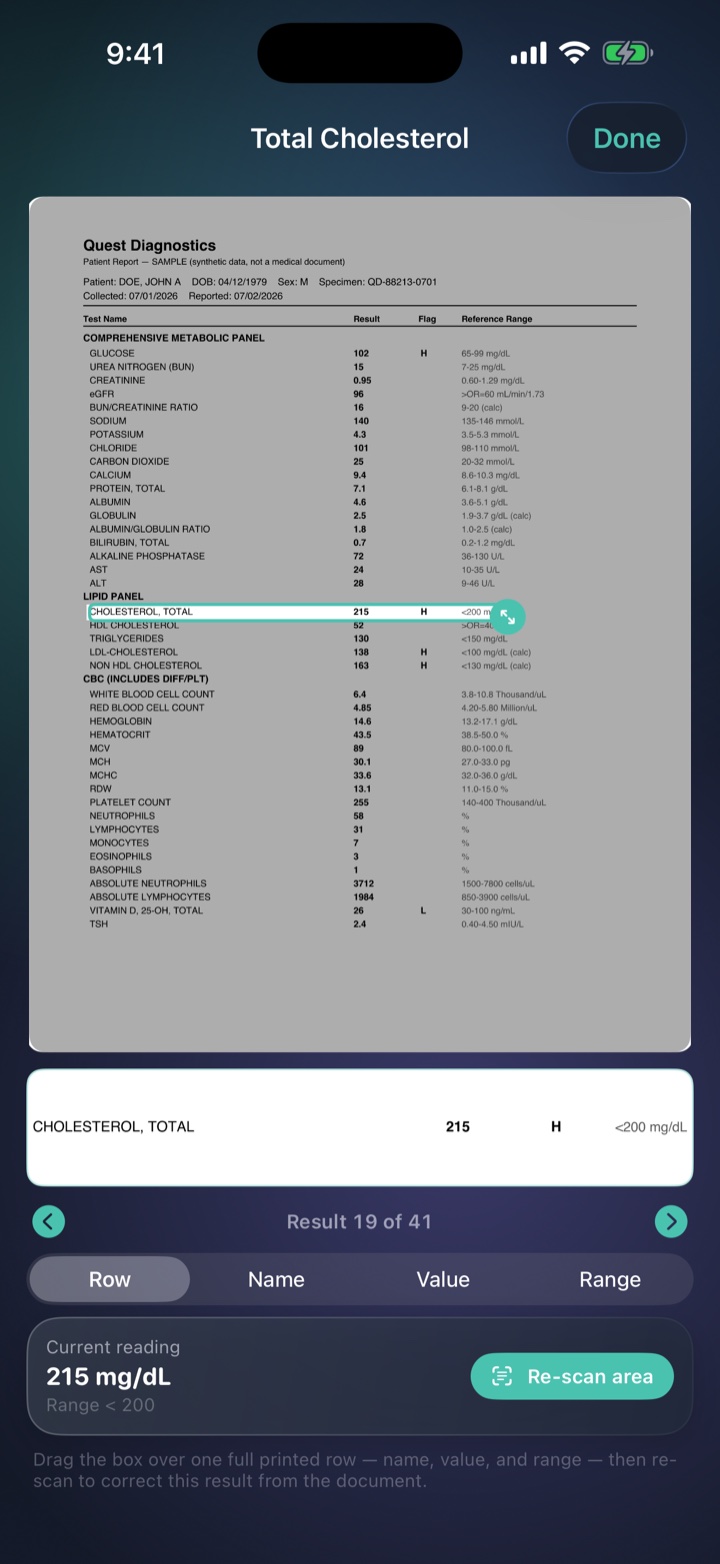
Every value Labstrack reads is linked to the spot on your report it came from — boxed, right on the page. A PDF, a screenshot, or a photo of a paper printout: checking a scan is as intuitive as tapping a box. And nothing's ever perfect — if Labstrack misses a value, just draw a box around it yourself and it reads that spot.
Tap a result. See it on your report.
Scan a report and Labstrack boxes every value it found. Tap one to see it highlighted in place on the original. Not sure it read something correctly? Pick Name, Value or Range and the box snaps to that field — then re-scan just that spot to read it again.
- Every result linked to its exact place on the page
- Snap the box to the name, value or range and re-scan
- Missed a value? Draw a box around it and Labstrack reads it
- Works on any lab, any layout — no AI, no guesswork
Your proof, in any light
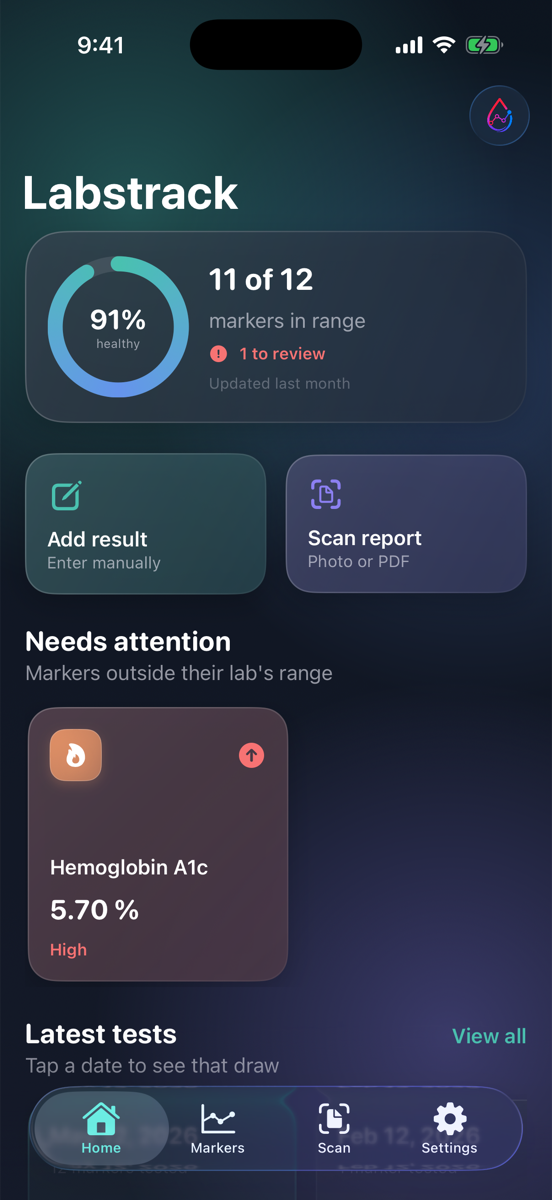
Every scanned result stays checkable against the page it came from, which Labstrack keeps unless you turn that off — adjust a box, re-scan a field, or draw a new one around anything the scan missed. And it all travels with you into dark mode, so your numbers are as clear at midnight as at 9 AM.
Trends, not numbers
Watch a marker move — against the range it was measured in
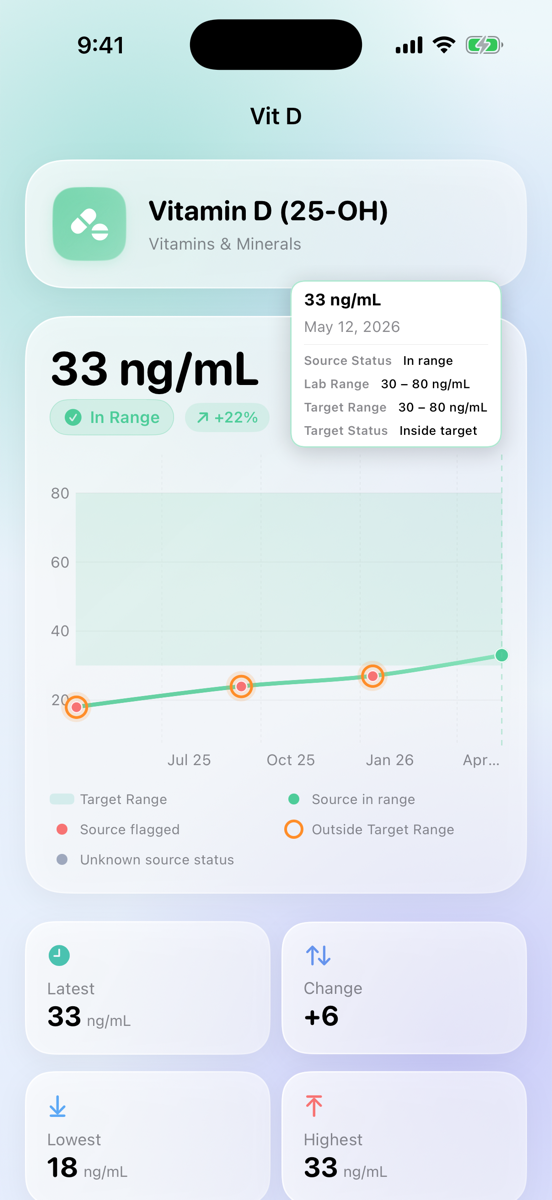
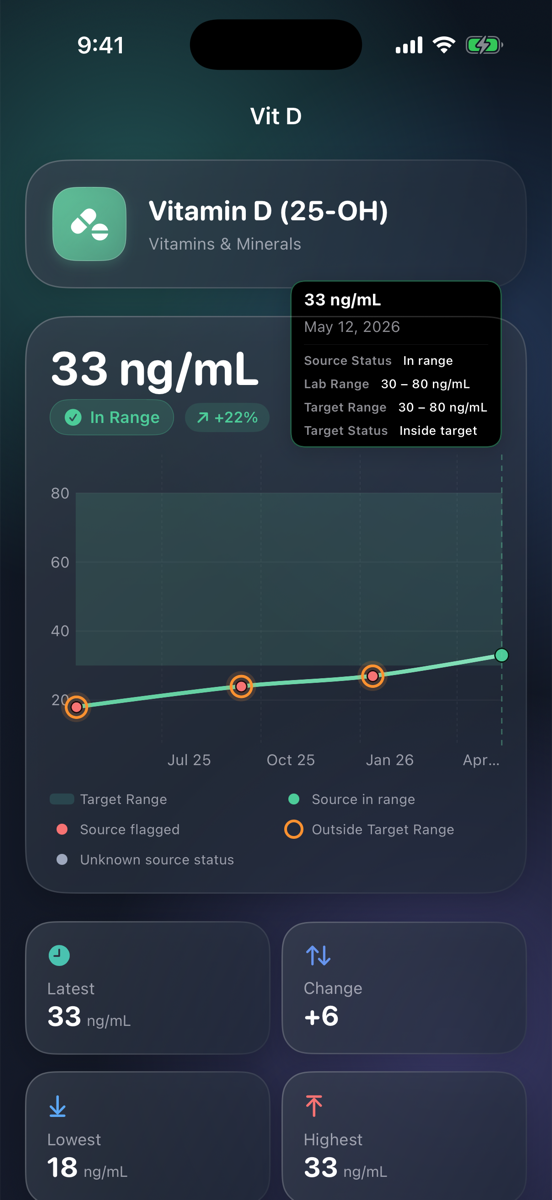
Different labs use different "normal" ranges, so Labstrack draws the range band per data point. Tap any reading to see exactly where it sat that day.
- Per-point reference bands from each lab
- Trend deltas and plain-language summaries
- Highs and lows flagged at a glance
You stay in charge
Nothing is saved until you say so
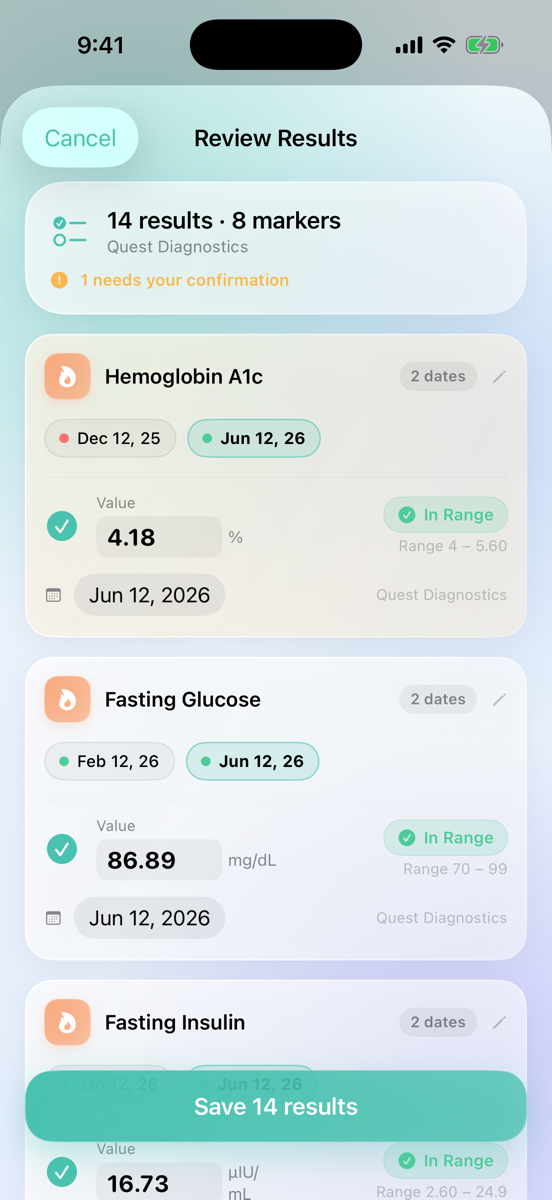
Every scanned result passes through a review screen — grouped by marker, dated, range-checked, and editable. Uncertain matches are flagged for you to confirm.
Organized for humans
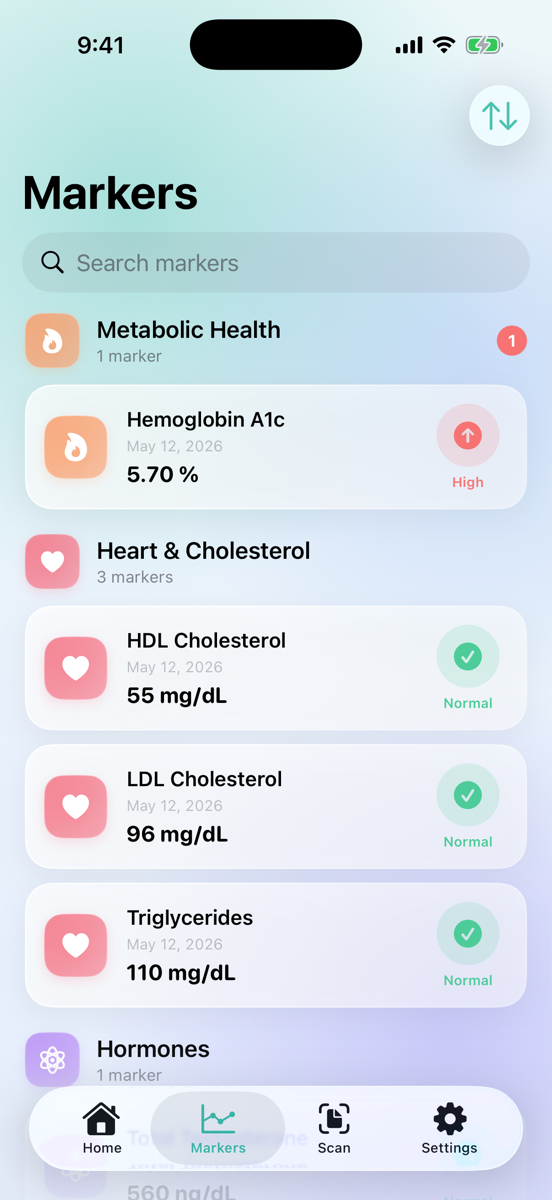
Every marker, grouped by what it means
Heart & cholesterol, metabolic health, vitamins, thyroid — browse your whole history by health area, or sort by what needs attention first.
Easy on the eyes
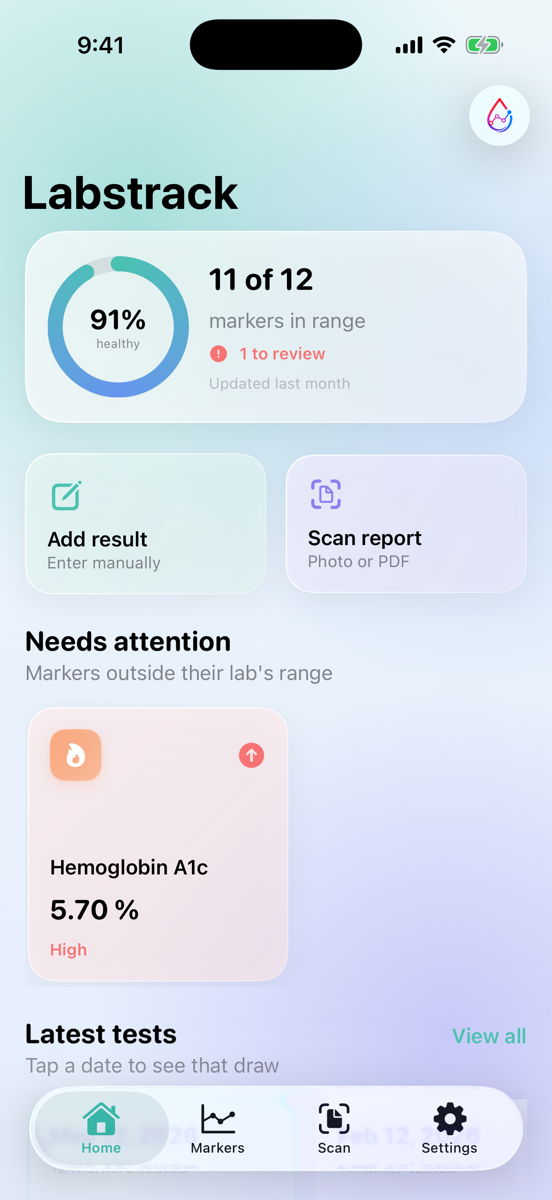
Gorgeous at 9 AM. Gentle at midnight.
Private by design
Your blood. Your data. Your device.
Every report is read entirely on your device — even tricky layouts are structured right on your iPhone. Labstrack never sends your records to us; it has no servers, no accounts, no ads, and no tracking. If you back up your iPhone itself, that backup includes Labstrack's data, like other apps'.